Phone: 850-339-4795 ; 850-459-2718
We are open: Mn-Fr: 10 am-8 pm

The attention span of people in today’s instant gratification age has decreased considerably. The behavioural patterns of consumers are different and highly unpredictable. In such a scenario, it becomes crucial that data generated from the online presence of the consumers get collected in real-time and gets examined to derive at factors that influence the behaviour and keep improving at it. It helps businesses identify the untapped market potential. Getting actionable insights becomes crucial here.
In such a context, Tableau can be the Data Visualization Tool.
All businesses need data analysis to formulate their in-house strategies, brainstorm on and reach out to their target customers in the best way. Gone are the days of the practice of Paperwork and creating Files. Today is a Digital age; most Teams handling data are in remote working and Work from Home (WFH) modes, thanks to the Pandemic. A recent article in a popular magazine says that an average Data Analyst is pre-occupied more on collecting data from various tools and sources than the actual data analytics task. In such a case, when they need to be in ‘Real Action Mode’ all their precious productive-time and energy is wasted on a mundane task. It disables the company’s decision-makers to take strategic decisions.
While trying to seek solutions to these challenges, many businesses have felt the need of a seamless, user-friendly and intuitive tool which eliminates the need to go back to the drawing board for all the questions that the Marketing team can have. In today’s age, Time is the most precious commodity and data is the new gold. All businesses, small or big, need a tool that can help manage, assimilate and handle the data from all sources on a single platform and present the same with better visuals, and keeping it simple while doing so.
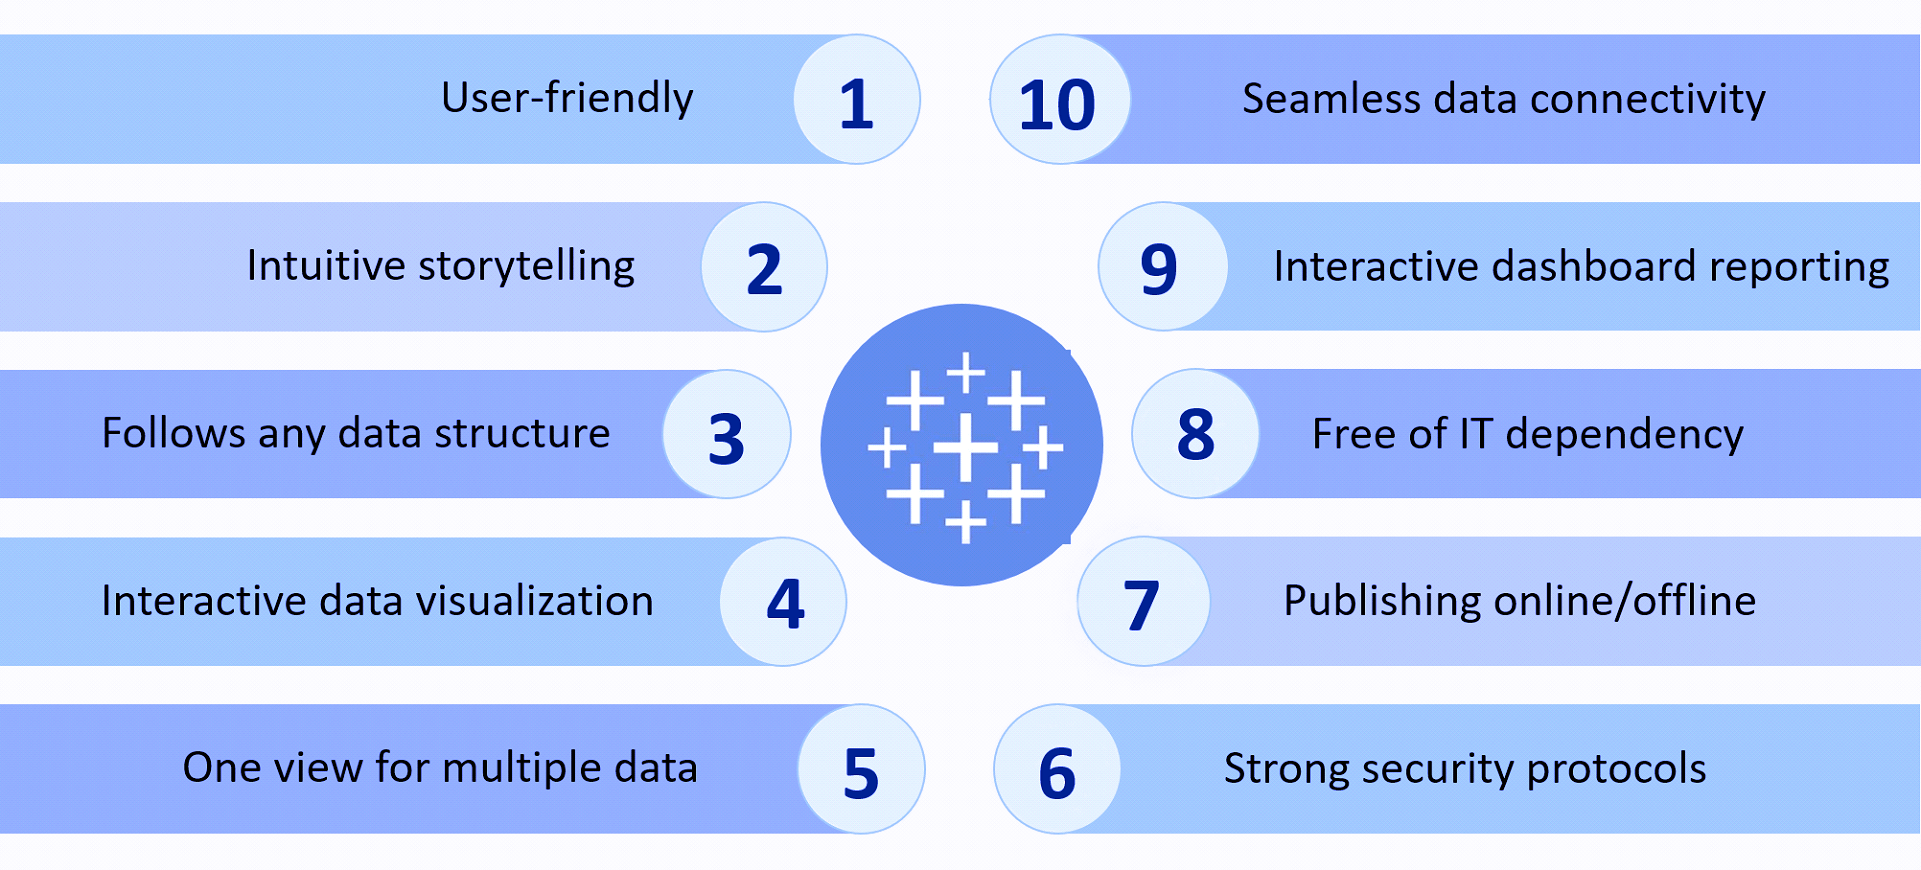
As data continues to dominate the marketplace, companies are looking to collate and examine diverse and complex information. Tableau helps shares the actionable insights that are relevant and in easy-to-understand reports. Integration with more than 100 built-in data connection points makes Tableau a one-stop data-visual and analytics tool. It can create a single view and explore multiple reports on a single page. Extracting a lot of data is cumbersome in tools like Excel. Tableau has no such limitations as it helps you view millions of rows of data and to scale up or down as per the requirement. It gives a complete picture of your business thus sparing resources’ time-crunches.
Tableau also supports revisions and multiple iterations of reports helping in identifying changes. Overall, using Tableau make better business sense which helps in any organizations’ revenue, growth, profits and richer user experience – all at one go.
We at Deerspring can be your Ideal Partner to mentor, train, implement and execute your Tableau goals effectively.
We will work with stakeholders in your Team in the following ways:
So, if it is the rollout of Tableau at your end, remember us at Deerspring!